
IV Rank vs. IV Percentile: Which One Should Guide Your Options Strategy?
IVR and IVP provide historical context for implied volatility
Management Summary
- Both, IVR and IVP provide historical context for implied volatility, helping traders assess whether current option premiums are relatively high or low compared to past levels, rather than relying on absolute IV alone.
- Converging Values (Alignment): When IVR and IVP closely agree, volatility appears well-positioned within its historical range and distribution, with little influence from outliers. High values suggest relatively rich option premiums, while low values suggest relatively inexpensive premiums compared with recent history.
- Low IVR / High IVP: Often reflects a distorted IVR caused by a past volatility outlier. While IVR appears low, IVP may show that implied volatility remains elevated relative to most historical observations, making option-selling strategies worth considering.
- High IVR / Low IVP: Suggests a recent volatility spike from historically low levels. The move may represent the beginning of a new volatility regime, making aggressive volatility-selling strategies less attractive until the market stabilizes.
Understanding IVR and IVP in Options Trading
Implied Volatility Rank (IVR) and Implied Volatility Percentile (IVP) are two commonly used metrics in options trading to contextualize current implied volatility (IV) within its historical range. Rather than relying on absolute IV values, traders use these measures to understand whether options are relatively expensive or cheap compared to past market conditions.
Both IVR and IVP serve a similar purpose but approach the problem differently, which is why they are often used together for a more complete picture.
Why IVR and IVP Matter
Both IVR and IVP provide historical context for implied volatility, helping traders assess whether current option premiums are relatively high or low compared to past levels, rather than relying on absolute IV alone.
This is important because implied volatility is highly asset-dependent. A “high” IV for one underlying may be normal for another. By normalizing IV against its own history, traders can better evaluate whether current option prices are attractive for strategies such as volatility selling or buying.
Close IVR / IVP Values
When IVR and IVP closely agree, volatility is considered to be well-positioned within its historical range and distribution, with little influence from outliers. In these conditions, both metrics tend to reinforce each other:
- High IVR and high IVP suggest elevated volatility relative to history
- Low IVR and low IVP suggest suppressed volatility conditions
This alignment makes interpretation more straightforward. High values generally indicate relatively rich option premiums, while low values suggest relatively inexpensive premiums compared with recent history. In such environments, traders often view signals as more stable and less distorted by statistical anomalies.
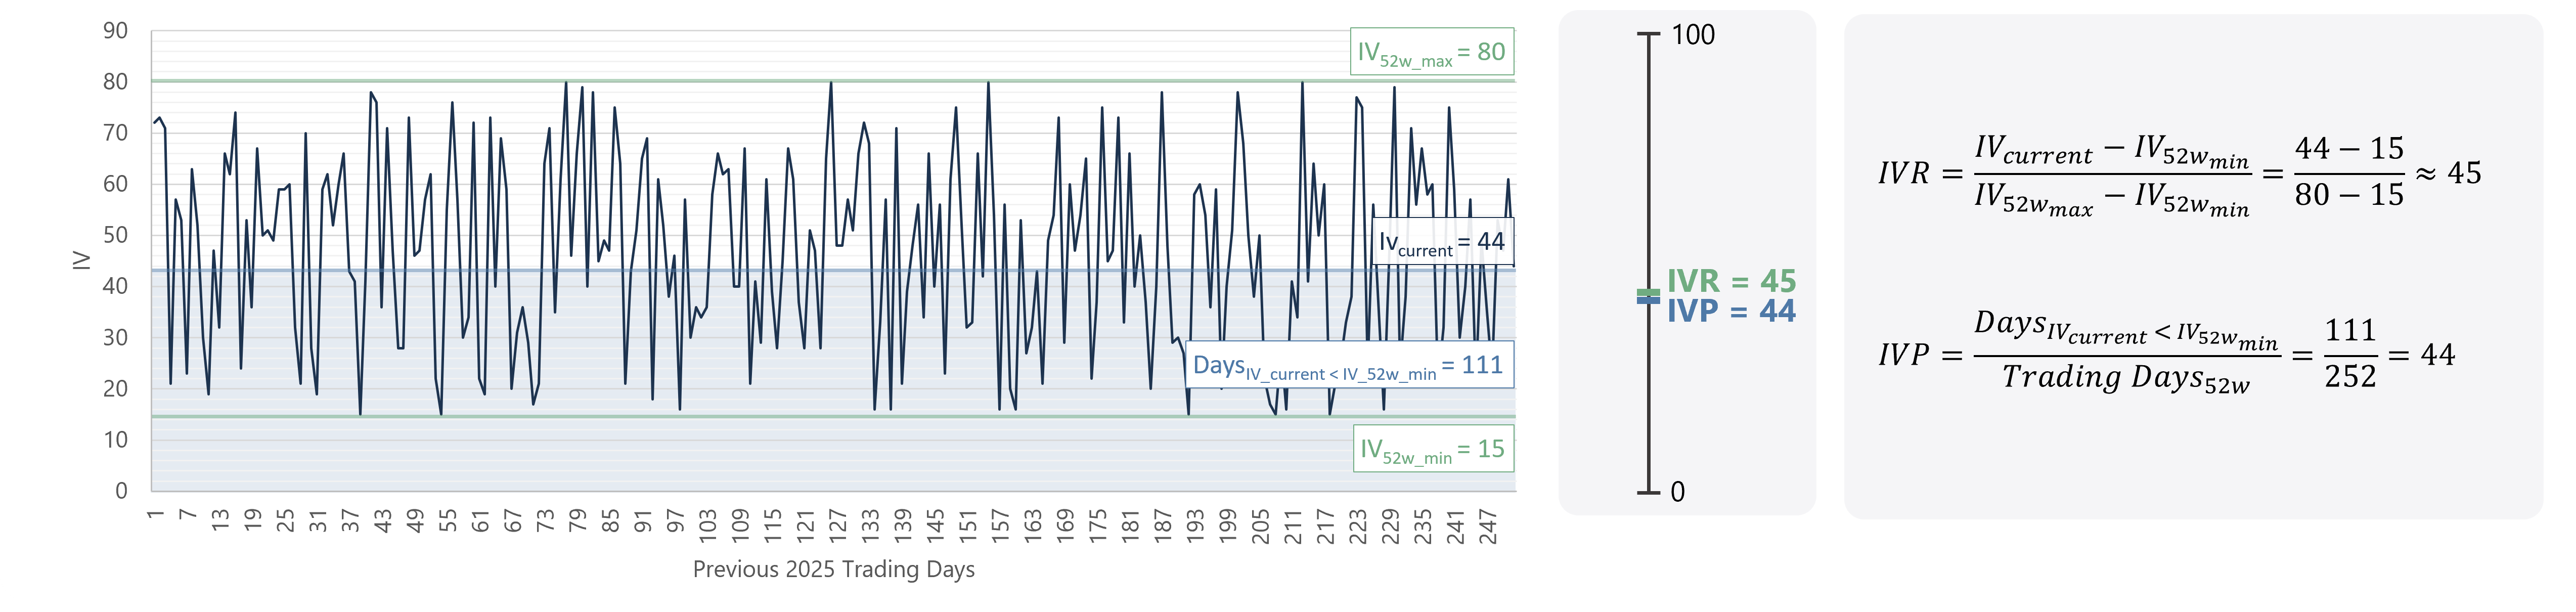 Figure 1: Example with close calues of IVP and IVR
Low IVR / High IVP: Outlier Distortion
A Low IVR combined with a High IVP often reflects a distortion in the IVR caused by a past volatility spike. In this scenario, a short-lived extreme event in historical data inflates the upper bound of IVR, which compresses the current ranking downward. However, IVP—which is based on the distribution of observed values—may still show that current implied volatility is relatively elevated compared to most historical observations.
This divergence suggests that IVR alone may underestimate the true relative level of volatility. In such cases, IVP can provide a more representative view of where current implied volatility stands within the historical distribution, potentially supporting volatility-selling strategies when combined with broader market context.
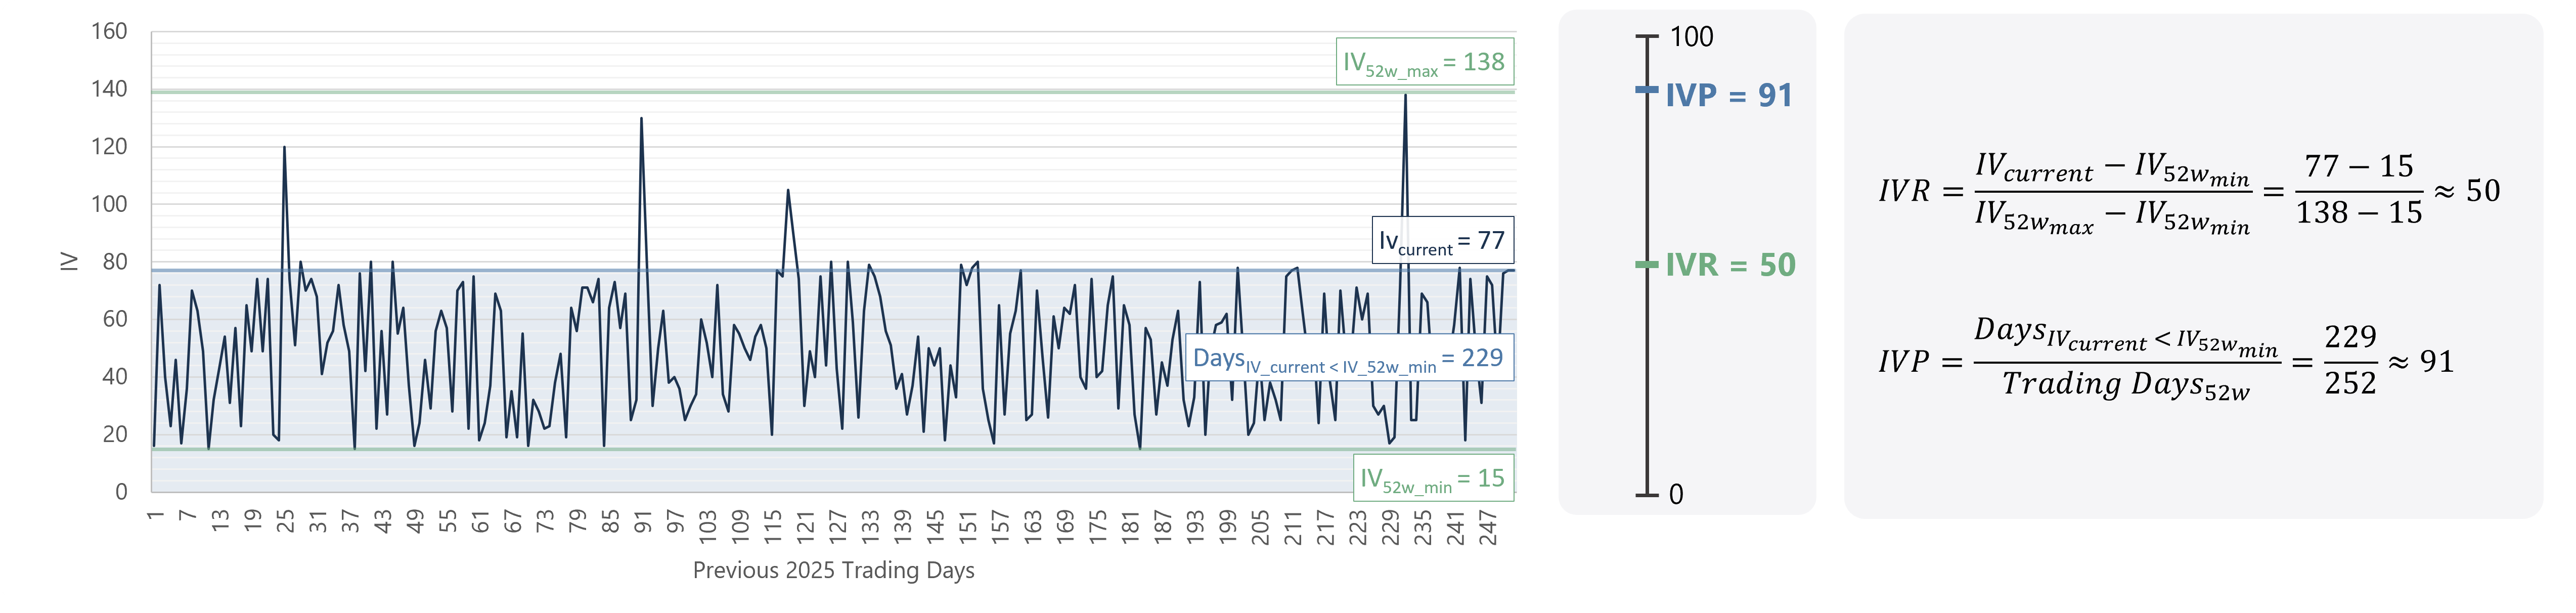 Figure 2: Example with gap in values of IVP and IVR
High IVR / Low IVP: Emerging Volatility Regime
A High IVR combined with a Low IVP typically indicates a recent and sharp increase in implied volatility after a prolonged period of low volatility.
Here, IVR reacts quickly to the new highs, while IVP remains lower because the elevated volatility has not yet persisted long enough to dominate the historical distribution. This pattern can be consistent with the early stages of a volatility regime change. However, it does not provide directional information about whether volatility will continue to expand or revert. In practice, such conditions are often associated with increased uncertainty, making aggressive volatility-selling strategies less attractive until the market stabilizes.
Conclusion
IVR and IVP are not predictive tools. They do not indicate where volatility will go next, nor do they define whether options are objectively overpriced or underpriced. Instead, they provide a standardized framework for comparing current implied volatility to its own historical behavior. Used together, they help traders:
- Identify whether volatility is relatively high or low
- Detect inconsistencies or distortions in historical data
- Improve timing decisions for volatility-based strategies
When combined with broader market analysis, IVR and IVP can be valuable components of a systematic options trading approach.
This article is for educational and informational purposes only. It does not constitute investment advice or a recommendation to buy or sell any financial instrument. All trading decisions are made at your own risk.